
I think we need to adopt nuclear power in Australia to effectively address our nation’s contributions to climate change. Some may disagree that it is a good idea for any reason at all, but they would be disagreeing with the IPCC.
They may argue that Australia’s proportional emissions are such a small fraction in context that arguably dramatic climate action is unnecessary. Certainly context does matter, but the ill-fated carbon price, one of the first in the world, did influence emissions without bringing disaster to the economy, and was a display of strong leadership in our region.
Oh, they just don’t want nuclear in Australia! It’s good for emissions, it’s no problem in most countries – who may even buy our grudgingly-extracted uranium for it – but they just don’t want it here? Nuclear is a proven climate change tool which is supported by respected conservation scientists in Australia and abroad, by Australian engineering peak bodies, by my state’s peak business advocates, by the CEO of Australia’s leading integrated energy company, and by our national experts. For what it’s worth, I want solutions to climate change in my backyard.
“But Environmental Non-Governmental Organisations say it will take 15 years ‘or more’ to bring in nuclear from scratch.” Yes they do, and although I’ve never seen the basis for this figure, it’s what I’ll work with in this article.
Part I – Wind & Solar
The following analysis was directly inspired by Geoff Russell’s May 2013 article. (For those who’ve made it this far, but still doubt the net benefits of nuclear power, he wrote a little book, Greenjacked!, which is worth the virtual pocket change and will supply indispensable context.) This is the relevant chart:

The UAE shows what a country with no nuclear could achieve given the political will. By 2020, about 12 years after notifying the IAEA, the Emirates will be getting 44 terawatt hours of power [sic] annually from its South Korean reactors. This is a per capita addition of some 3400 kwh/yr of clean electricity. It’s not enough, but as the chart shows, it’s nearly three-and-a-half times faster than the German wind and solar rollout.
As you can also see from the chart, if all goes well, the UAE will have added electricity faster with nuclear alone than the Chinese have done using all sources, including coal, during the past 11 years.
I wanted to firstly check Australia’s progress in adding zero-carbon capacity with real numbers which weren’t available back then. We have good data for household photovoltaic (PV) solar, which certainly looks impressive:

With clear installation rate data:

Which gives a 2013-2014 inclusive average of 816.5 megawatts per year (MW/yr). Examination of 2013 capacity (averaging 2930 MW) and generation (3.82 terawatt hours) provides an Australian PV capacity factor of 14.9%. This means that the two consistently best years of PV addition, for a population now at 23,706,600, is 45.5 kilowatt hours per person (kWhr/capita) annually.

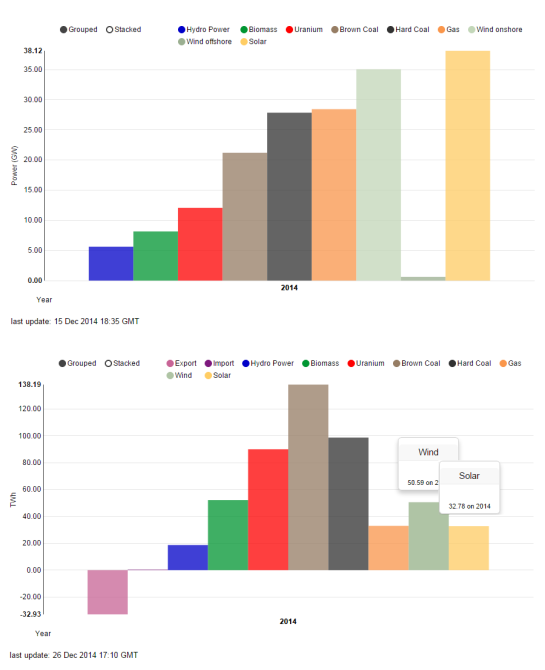
Australian wind power enjoys a high average capacity factor of 35% and a phenomenal annualised build rate in 2013-2014 of 2281.5 GWh/yr, or 96.2 kWhr/capita.
Calculating the “per person” rate is useful. It makes it more of a human issue, and ties it to an important statistic: Australian per capita electrical consumption, which was 10712.18 kW in 2011. It lets us calculate that Australia’s historical best push for wind and solar together (at 141.8 kWh/capita annually) will satisfy that average consumption in 75 years, or, more realistically, half of it in 37 years. Obviously a rising population (which I will not consider here) will tend to increase the denominator and add years to this estimate, so what can be done to decrease it? We could accelerate those renewables, but this will be unlikely for PV without increasing expensive incentives, and even more-so for wind power in the short term (despite recent large additions sensibly being in high capacity factor locations). More fundamentally, Australia’s best effort would already be ahead of Germany’s:

Australia’s projected comparison best effort over 11 years (purple).
We could reduce overall electricity use: better insulated homes with double-glazing, lower wattage efficient lighting, standby power isolators, modern heatpumps and evacuated tube solar water heaters… Undoubtedly, there will be a lot of this, and it will be easier to achieve than any speculative mass change in behaviour. But recall Mr Russell’s point regarding Sweden, which uses around 15,000 kWh/capita:
This is way more than we use in Australia (10,000 kwh/person/yr), but they only generate 25 gms of CO2 per kwh, so who gives a damn how much electricity they use? Swedish electricity is about 50:50 nuclear and hydro. Scale back their profligacy and they’ve got plenty to charge electric vehicles and so on.
I contend that the undeniable need for a transition to majority electric vehicles in something far shorter than forty years is vital. Using Tom Murphy’s figures for the Tesla EV (13.7 kWh/100 km) and assuming a charging efficiency of 90%, each will add an extra 1956 kWh of electrical demand for charging per car. At 13 million cars, that’s over 1000 extra annual kWh/capita.
In addition, we will need desal. Efficient sea water reverse osmosis (SWRO) requires about 3 kW per cubic metre, or kilolitre. Replacing all 930 kL used by each Australian in 2005 would add another 2790 kWh/capita to yearly demand. Less than this would still go some way to relieving pressure on our artesian basin and major rivers.
I like to call these factors “demand destruction destruction” – the necessary electrification of future capacity. I won’t add these to the tally because estimating the most likely extent of EV and desal adoption is beyond the scope of this article. But they’re there, and they will help in the long run – if we have the electricity for them.
There are other challenges. This build out would result in approximately 31.2 GW of PV and 28.1 GW of wind capacity – roughly seven times what we have of each today. For the average rooftop PV installation of 4.3 kW, we will need 83% of today’s households. which may be a problem with a rate of home ownership at 67% and gradually falling, and no real incentive scheme for landlords. A large amount of this could well be in the form of solar farms, which Mr Russell has also analysed in detail, and based on his reference Moree site (at 150 MW) each gigawatt of solar farm would be over 50,000 truckloads of material and occupy over 7,900 hectares of land. The panels and wind turbines last roughly 25 years – at least half will effectively be installed twice over before the task is complete. And of course there’s appropriate grid upgrades and transmission infrastructure to be added.

Then there’s the bright, windy days. Demand last summer topped out around 34 GW, but we’ll have over 59 GW of wind and solar capacity, each penetrating the market way over their capacity factors. 50 GW of renewable energy can’t be fed to the grid if 50 GW isn’t being demanded. Will vendors want to be compensated? Who will take responsibility for curtailment? Storage? We might as well wish for economical HVDC interconnection to Indonesia, and hope they still need our surplus electricity.
2014 capacity vs generation in Germany. Despite market price disruption by subsidised wind and solar, ordinary consumers are increasingly suffering.
And the biggest question of all: how much carbon has this abated? Hopefully a lot, but I’m afraid I don’t see this emphasised by many commentators who favour renewable energy. In fact, much of the time the potential of renewables just seems taken as gospel. And regardless of marketing, spin or preferential advocacy, the 85.1% of Austrlian solar and the 65% of wind power that won’t be on the grid, on average, will be backed up by a substantial portion of fossil fuel combustion.
Part II – Nuclear
In 2012-2013 power plants around Australia generated various amounts of MWs and emitted so much tonnes of carbon dioxide equivalent (tCO2-e). Choosing a few of the most polluting gives a selection from each state, concentrating on the Victorian lignite stations.

94.4 million tonnes is just shy of half of Australia’s total electricity emissions, estimated in 2009-2010 at 195 MtCO2-e. Bearing in mind that disrupting the status quo always affects people, we still need to close these coal plants. We can use some of the same sites and much of the existing infrastructure for the reference nuclear option: the AFCR.

Fuel versatility and recycling with the Advanced Fuel CANDU Reactor.
This is essentially the Enhanced CANDU 6 detailed in the Zero Carbon Options Report, except now, in addition to running on uranium at natural enrichment levels, it can run on recycled natural uranium equivalent fuel, as well as blended thorium/uranium. Based on the biggest turbine sizes found in Australian power plants, it is perhaps the largest plant that our grid could handle right now. Each is classed as a 700 MW unit, with an expected 95% capacity factor based on the performance of CANDU 6 plants around the world. That will mean 60 years of delivering 5.83 TWh/yr essentially uninterupted, which will mean we need to build fifteen of them.

Wolsong CANDU reactors, South Korea. Supreme energy density.
Hey, they said fifteen years – they didn’t say per reactor.
EC6s are generally built on time – 5 years or under – and on budget. Construction should be staggered to coordinate with suppliers and allow transfer of Australian FOAK lessons to benefit the NOAK, as long as all fifteen reactors are underway by the 10 year mark. This may benefit from a rigorous fact finding process involving South Korea, China, Argentina and Romania, in the initial two or so years when Australia’s climate action-aggressive, scientifically-informed regulatory framework is being established (following the repeal of our arbitrary nuclear prohibition).
Fifteen years to install 10.5 GW of state of the art, versatile, always on, historically safe Canadian nuclear capacity. As the last reactor is connected to the grid, the last coal plant in the above list can be shut down for the final time, and average Australian electricity emissions will be around 100 million tonnes of CO2-e. Our clean capacity annual addition rate has been an average of 245.9 kWh/capita. Fifteen reactors sounds like a big ask, but more has been done faster before.

Average addition rate of modern CANDU capacity (blue).
Just like with wind and solar, several factors can affect this rate. There may be delays: unavoidable ones like major component supply bottlenecks or a lag in expertise, or entirely avoidable ones such as funded, organised nuclear opposition acting simply to further delay Australian nuclear development rather than responsibly involve itself as a productive stakeholder in the rapid, science-informed decarbonisation process. Additional grid upgrades will likely be unavoidable. On the other hand, concomitant efficiency increases would bring closer the day that last coal plant burns its last furnace-load.
Again, I’m choosing to ignore population growth, a factor which I expect will seriously complicate any realistic scenario. That leaves the electric vehicle fleet, which is often treated as a convenient battery for renewables-dominated grid models, but with a high proportion of nuclear electricity available on a constant basis no one needs to modify their automotive habits – just plug in whenever is convenient or cheapest or both – and the extra grid-managed battery cycling can be avoided. To cover the entirety of this extra demand would take another eight years of nuclear build-out.

MED-TVC desalination.
What about desal? Well, this is the really good news, because nuclear capacity directly opens a new world of large-scale efficiency which wind and solar frankly would not. Multiple effect distillation with thermal vapour compression utilises the steam out of the nuclear plant turbines to economically desalinate water more efficiently than SWRO can. This would involve a drop in overall electrical output, but since modern CANDU reactors are invariably rated well above 700 MW it doesn’t affect this article’s estimations. Running it on waste heat from steam turbines is the most supremely efficient approach to desalination (desal-dedicated nuclear is even being considered in South Korea). It can be achieved to some degree with renewable energy, of course, but why sacrifice this efficiency just to maintain a rejection of nuclear?
In comparing the contributions of a massive expansion of both wind and solar versus nuclear in the form of fifteen CANDU reactors, some might say two against one isn’t a fair competition. As long as I’m assuming the rapid adoption of effective, evidence-led decarbonisation policy, let me add the IFR to the mix. Compared to CANDU, it is less well demonstrated but IFRs in the form of PRISM – or something like it – will be needed in the future as a rational and economical tool for nuclear material recycling.

The GE Hitachi Advance Recycling Center, incorporating the PRISM 311 MW small modular sodium-cooled fast reactor, would generate its own fuel as well as fuel for CANDU reactors from other nations’ high level “nuclear waste”.
This is what real environmental responsibility entails: deploying the technology to deal with by-products of civilisation’s needs. The current and future inventory of recyclable nuclear fuel is a contentious issue in many countries – how much would they pay Australia to take it? Of course, each PRISM is smaller and to slot into our scenario would need to be built in a rough ratio of 4:9 CANDU to PRISM. The overwhelming advantage of taking this step would be to effectively by-pass the need for constant mining and enrichment of domestic nuclear fuel – processing and fabrication is largely handled by the advanced fuel recycling center (which is powered by the attached fast reactors). Without mining and enrichment, or fossil-fueled nuclear fuel production, every megawatt would be truly carbon-free.
Part III – Wind & Solar & Nuclear
The two separate approaches I have used for deriving these annual rates reflect the different magnitudes of certainty we can realistically have about directly and decisively replacing fossil fuel generation. I think it is now straightforward: begin a decarbonisation-focused adoption of modern nuclear energy capacity, at what would be a modest rate in comparison to the most successful historical efforts, and in addition to continued expansion of successful renewable capacity. Have I claimed anywhere that it would be easy? Of course not. Neither approach will be: a single year lacking in bipartisan support and regulatory certainty was enough to bring the renewable energy industry to “a standstill“.
Correcting the vociferous “renewable energy only” voices on the intrinsic limitations of the two superstar intermittent low carbon renewable technologies is not at all “anti-renewables”, though it is often labelled so. In my experience so far, it is mainly these loud commentators who perpetuate the idea that it is a competition (it should be nothing of the kind). I have found most nuclear advocates to be far more focused on carbon-abatement, and it is not renewables that bother them, it is the unreasonable overselling and the ill-informed policy that sometimes is the result.
You’re probably sick of that graph by now, but if you add the purple line to the blue line it gives a respectable annual rate of electricity decarbonisation, something like an average of 390 kWh/capita. Realistically, these are surely best case scenarios: Australian anti-nuclearism will not be swayed overnight, and wind and solar would top out before reaching those calculated levels of penetration for purely technical reasons. Of course, the way to ensure we get nowhere near it is to put off nuclear indefinitely.
We can be quite sure that, with human willpower, nuclear won’t take too long. With all the tools in the box, we might make quick work of it after all. And the cost?

The coal stations you list will all need to be replaced by 2040 at the latest. Knocking off 100 Mt from power sector emissions is far more impressive than the 13 Mt or whatever we’ve cut from all sectors since year 2000. No mention of gas which is 21% of our electricity now threatened by east coast LNG exports. I don’t see EVs finding a mass market until they have 300km range for a $20k sticker price…maybe it won’t happen. Otherwise curtailed output of overbuilt intermittents could be used to make hydrogen for synfuels. If the newest CANDU actually ‘burns’ thorium that’s good because we have plenty. Let’s build one starting ASAP.
Thank you as always for the comment, John. I agree that volatile gas prices and development will be a big complicating factor, and not just for gas baseload and peaking plants – households and businesses who have recently switched from (expensive) power to gas will be hit hard by whatever costs we must bear for this rapid transition, even if we do it smart for a change. Perhaps if the economics work out we could be gasifying coal to feed these brutes? http://breakingenergy.com/2014/11/14/ccs-breakthrough-sco2-power-cycles-offer-improved-efficiency-and-integrated-carbon-capture/
I could have made it clearer that EVs were more of an example than a necessity. Surely they will find buyers in capital cities but these are linked by unavoidable highways, many of which have been recently expanded and fortified. Lower emission synthetic fuels will probably suit Australian distances in a carbon-limited context. Also, NNadir makes some solid points http://bravenewclimate.com/2014/12/29/current-world-energy-demand-ethical-world-energy-demand-depleted-uranium-and-the-centuries-to-come/
I wasn’t aware of chapter 5 of Getting to Zero http://www.dailykos.com/story/2014/12/31/1354811/-Deep-Decarbonization-report-high-renewable-path-costs-4x-more-than-high-nuclear-alternative# till today, which summarises cost a little more thoroughly.
Pingback: Nuclear Opposition on Notice | The Actinide Age