An advantage of South Australia’s dramatically high share of solar and wind generation share (about 43% in 2017) is that simulating even larger shares is easy. This is mainly thanks to the high level of correlation: more rooftop solar and more windfarms will tend to be installed not far from what already exists. Simply multiplying output data from previous periods gives a fair working approximation of what would be if more were built – a method originally described at WattClarity in 2015.
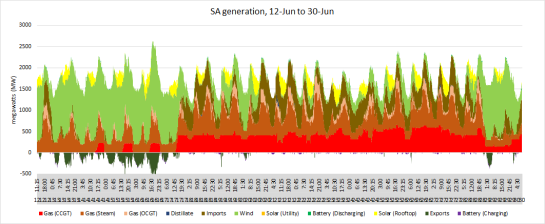
The basis for this exercise is the 5-minute generation data from June 12th to 30th courtesy of OpenNEM. With my calculator modified to visualise South Australia, it looked like this:
Note that a base of gas-fired generation was maintained at no lower than about 220 megawatts. For the majority of the time, this was from the state’s combined cycle gas power stations, and indeed they ran full tilt to meet evening peak demand on the 26th. Even so, flexible gas plant represented a much higher share overall for following load.
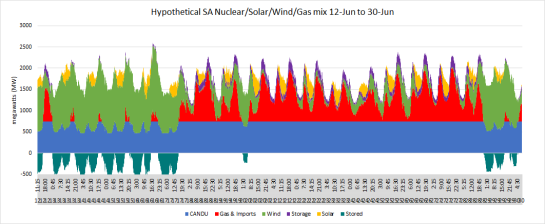
Wind data is multiplied by 3.3x and rooftop PV by 2x. Why these factors? It makes the excess renewable energy through to the 17th match up to the amount of demand subsequently served by fossil fuels and imports until about noon on the 28th. Actually, it’s 80% because that’s the roundtrip efficiency assumed for pumped hydro storage here.
How much pumped hydro storage? Over 233 gigawatt hours. While this would be covered by the Snowy 2.0 project (350 gigawatt hours), South Australia only has the geography for much smaller installations like at Middleback Ranges (390 megawatt hours, $170 million capital cost) – though probably far from 600 of them. And besides, some would insist Snowy 2.0 is inferior to more distributed storage.
Therefore, assuming $1,900 per kilowatt installed for new wind from AEMO’s ISP, and $966 per kilowatt for solar PV based on new 5 kW systems from SolarChoice, the hypothetical total cost of overbuilding renewable energy (1,900 x 4,163,000 = 7.9 billion plus 966 x 885 = 854 million) and the storage to enable it (170,000,000 x 598 = 101 billion) is $110 billion under this simple simulation.
What’s the alternative? We can imagine endless alternatives, but I’m inspired by a prophetic supposition made by Jesse Jenkins several years ago:
If you want an ultra-low carbon renewable energy system, you need storage and flexibility. And if you have storage and flexibility, then renewables play just fine with nuclear.

CANDU reactors made this possible today.
Anyone following nuclear and energy in South Australia will be familiar with Zero Carbon Options, the first robust work to properly suggest an alternative to the dominant approach of trying to replace fossil fuels with renewable energy, which featured a single CANDU reactor in place of our old coal-fired station. This simulation adds a 740 megawatt unit at a capital cost of $9.7 billion based on Parsons Brinkerhoff figures provided to the Nuclear Fuel Cycle Royal Commission, including first-of-a-kind project development and licensing costs.
While the wind was strong, excess wind and nuclear was diverted from the grid to storage, in this case a 1:1 mix of pumped hydro (the equivalent of 34 Middleback Ranges projects – $5.9 billion) and about 13.4 gigawatt hours of vanadium redox flow batteries (with a future cost of $313 per kilowatt hour from Lazard – $4.2 billion) which I vastly prefer to lithium ion for fast-response capacity due to the superior chemistry and significantly longer lifecycle. As before, 80% was returned to serve demand. Generation was not ultra-low carbon yet since gas and imports still met some demand, but they were slashed by two-thirds compared with the first chart (which is what happened in reality on the days in question), peaking at less than a half of the original. Total cost: $19.8 billion under this simple simulation: two-thirds the way there for less than 1/5 the price.
Wind and solar as fuel-saving resources, and energy storage as a fast burst resource – they’re weak substitutes at best for firm resources, and if we try to make them play roles that they’re not well-suited for in the energy mix… it’s much more challenging and it’s much more costly…
~ Dr Jesse Jenkins on MIT Energy Initiative Podcast
Note that computing the price of delivered energy is beyond the capabilities of this simulation, especially when the erosion of marginal value with increasing market share is appreciated. Other modelling efforts have started to look at these details. Note also that energy storage isn’t utilised in this manner in any grid in the world – this and any assumptions and exercises like it are currently hypothetical.
To tackle the last portions of fossil fuel in this limited, simplified simulation might need more wind or solar, with more storage capacity, or a big whack of demand managment, or maybe some biomass capacity, or a combination. Perhaps more nuclear capacity would make this task even easier. There’s cost involved, but we needn’t make it too high to pay.


