Investment and Duration

Let’s be clear on this unseemly notion of excluding sources of climate-friendly energy in the face of the staggering challenge of replacing fossil fuels and averting the potential harm of climate change. Let’s be crystal clear on who wants to exclude what.

Apparently no geothermal, solar thermal, offshore wind or nuclear energy for Australia by 2040 .

Maybe this paragraph is familiar? It’s authors won an award:

Heroic assumptions about future technology development are avoided: the only low emission technologies considered are those that are being deployed in large quantities (>10 GW per year), namely PV and wind. On this basis, nuclear, bio, solar thermal, geothermal and ocean energy are excluded.

(Unstated but quantitatively implied in this widely reported study: “wind” does not include off-shore wind.)

Needless to say, I disagree with the a priori dismissal of any potential low emissions source.

The following table of large Australian projects which are not photovoltaic solar or on-shore wind is included for reference and will be kept updated. It is up to individual readers to judge if they cost “too much” or take “too long”.

These reported and derived numbers are offered without prejudice against any energy source. This exercise is inspired by the tireless analysis at WattClarity. Comments and corrections offered in the same spirit are welcome in the reply field below.


Underpinned

An advantage of South Australia’s dramatically high share of solar and wind generation share (about 43% in 2017) is that simulating even larger shares is easy. This is mainly thanks to the high level of correlation: more rooftop solar and more windfarms will tend to be installed not far from what already exists. Simply multiplying output data from previous periods gives a fair working approximation of what would be if more were built – a method originally described at WattClarity in 2015.

The basis for this exercise is the 5-minute generation data from June 12th to 30th courtesy of OpenNEM. With my calculator modified to visualise South Australia, it looked like this:

Note that a base of gas-fired generation was maintained at no lower than about 220 megawatts. For the majority of the time, this was from the state’s combined cycle gas power stations, and indeed they ran full tilt to meet evening peak demand on the 26th. Even so, flexible gas plant represented a much higher share overall for following load.

Wind data is multiplied by 3.3x and rooftop PV by 2x. Why these factors? It makes the excess renewable energy through to the 17th match up to the amount of demand subsequently served by fossil fuels and imports until about noon on the 28th. Actually, it’s 80% because that’s the roundtrip efficiency assumed for pumped hydro storage here.

How much pumped hydro storage? Over 233 gigawatt hours. While this would be covered by the Snowy 2.0 project (350 gigawatt hours), South Australia only has the geography for much smaller installations like at Middleback Ranges (390 megawatt hours, $170 million capital cost) – though probably far from 600 of them. And besides, some would insist Snowy 2.0 is inferior to more distributed storage.

Therefore, assuming $1,900 per kilowatt installed for new wind from AEMO’s ISP, and $966 per kilowatt for solar PV based on new 5 kW systems from SolarChoice, the hypothetical total cost of overbuilding renewable energy (1,900 x 4,163,000 = 7.9 billion plus 966 x 885 = 854 million) and the storage to enable it (170,000,000 x 598 = 101 billion) is $110 billion under this simple simulation.

What’s the alternative? We can imagine endless alternatives, but I’m inspired by a prophetic supposition made by Jesse Jenkins several years ago:

If you want an ultra-low carbon renewable energy system, you need storage and flexibility. And if you have storage and flexibility, then renewables play just fine with nuclear.

CANDU reactors made this possible today.

Anyone following nuclear and energy in South Australia will be familiar with Zero Carbon Options, the first robust work to properly suggest an alternative to the dominant approach of trying to replace fossil fuels with renewable energy, which featured a single CANDU reactor in place of our old coal-fired station. This simulation adds a 740 megawatt unit at a capital cost of $9.7 billion based on Parsons Brinkerhoff figures provided to the Nuclear Fuel Cycle Royal Commission, including first-of-a-kind project development and licensing costs.

While the wind was strong, excess wind and nuclear was diverted from the grid to storage, in this case a 1:1 mix of pumped hydro (the equivalent of 34 Middleback Ranges projects – $5.9 billion) and about 13.4 gigawatt hours of vanadium redox flow batteries (with a future cost of $313 per kilowatt hour from Lazard – $4.2 billion) which I vastly prefer to lithium ion for fast-response capacity due to the superior chemistry and significantly longer lifecycle. As before, 80% was returned to serve demand. Generation was not ultra-low carbon yet since gas and imports still met some demand, but they were slashed by two-thirds compared with the first chart (which is what happened in reality on the days in question), peaking at less than a half of the original. Total cost: $19.8 billion under this simple simulation: two-thirds the way there for less than 1/5 the price.

Wind and solar as fuel-saving resources, and energy storage as a fast burst resource – they’re weak substitutes at best for firm resources, and if we try to make them play roles that they’re not well-suited for in the energy mix… it’s much more challenging and it’s much more costly

~ Dr Jesse Jenkins on MIT Energy Initiative Podcast

Note that computing the price of delivered energy is beyond the capabilities of this simulation, especially when the erosion of marginal value with increasing market share is appreciated. Other modelling efforts have started to look at these details. Note also that energy storage isn’t utilised in this manner in any grid in the world – this and any assumptions and exercises like it are currently hypothetical.

To tackle the last portions of fossil fuel in this limited, simplified simulation might need more wind or solar, with more storage capacity, or a big whack of demand managment, or maybe some biomass capacity, or a combination. Perhaps more nuclear capacity would make this task even easier. There’s cost involved, but we needn’t make it too high to pay.


Your Numbers, Please

We now live in a time of high quality electricity mix visualisations, such as electricity map. For Australia, OpenNEM has rapidly become the best, not least because it makes up to a week worth of 5-minute generation data available for free.

In this spirit, please feel free to download and play with the spreadsheet calculator I’ve designed.

  1. Download today’s national CSV file from OpenNEM.
  2. Select and copy the entire sheet.
  3. Paste it into the calculator in full.

The calculator comes with a recent, interesting week’s worth of data included. This is the chart.

By adjusting the multipliers for solar and wind capacity (this is a simplified simulation and assumes current geographical distribution across the NEM) an illustration of very high solar and wind penetration (on top of existing hydro) can be visualised. Times of high solar and/or wind result in substantial over-production. The first solution that comes to mind is to store this energy, and indeed, purely as an example, the glut of wind in the middle of the week would be shifted over to replace the coal and gas required the next day when wind is practically absent – even at eight times the NEM’s current nameplate capacity. This is 533,000 megawatt hours (MWh) stored and then discharged to meet 477,000 MWh, accounting for the roundtrip efficiency of batteries.

All fossil fuel sources are depressed proportionally as a product of the solar and wind mutlipliers. Real world considerations such as merit order are neglected.

It is fascinating that this is

  1. the same magnitude of storage required in this WattClarity analysis of a longer still interval from several years back;
  2. nearly 1.5 times the capacity suggested by AGL in this presentation.

If the US$50million 129 MWh Hornsdale Energy Reserve were operated like this bulk storage (which it isn’t), over 4,100 installations would be required.

If pumped hydro such as the AU$330million 2,000 MWh Kidston Stage 2 project were used instead, more than 300 such reservoir systems would be needed. These would operate many decades longer than Li-ion batteries, but have lower roundtrip efficiency. Consider how many technically and commercially viable sites are being seriously investigated today (spoiler: it’s 20).

Based only on reported project costs, this would require from $100 billion to $272 billion just in energy storage investment.

This many MWh of storage could be covered by less than four Snowy 2.0 projects (no more than $29 billion) but apparently this form of storage just ain’t as good, depending on who you ask.

The cost decline of Li-ion battery storage was investigated by the Finkel review, and the $520/kWh cost estimated here was not expected to plummet close to that for Kidston ($165/kWh) before 2050.

The obvious alternative, natural gas, would cost about $32 billion for enough flexible capacity to completely fill in the gaps in question, based on the reported cost of Reeves Plains power station approved for construction in rural South Australia this year. This presents greenhouse gas emmissions issues, explored here and here, especially as any short-comings in storage output must be made up by such flexible generation.

The costs estimated above still don’t include what must be spent on expanded solar and wind capacity. According to ACOLA (page 66), to 2016 $40 billion was spend building most of what we now have. Dollars-per-kilowatt-installed costs have dropped for solar and wind to a greater or lesser extent, and I invite readers to suggest sets of cost figures in the comments below which we might use to estimate the total investment required to generate what we see in the simulation.

Furthermore, assuming realistic average annual capacity factors for the operation of the expanded renewable energy capacity, an annual total around 252 terawatt hours would be generated on the NEM, which is 28% in excess of the 196.5 TWh for 2016-2017 reported by the AER.

All of these results are predicated on the simplifications and assumptions underlying the calculator. The way it functions has been kept as straightforward as possible so as to let the raw data do the talking, but all output, such as the featured chart, is hypothetical. The actual electrical network is complex, evolving, and nobody can say for certain what we’ll “end up with”; will we see more, or less, than another 20,000 megawatts of renewable energy added to the market? What about demand destruction destruction due to electrification of transport, or even electronic currencies? The advantages of greater geographical dispersal of solar and wind power plants, as well as the drawbacks (costs of expanded transmission), are neglected, along with technical considerations of storage options such as lifecycle emissions and Energy Returned on Invested, and of system intertia and FCAS. And last but not least, grid-scale storage has not been operated like this, at such scale, anywhere ever; it’s way too easy to forget that the whole idea is still notional right now.

So, download the calculator, have a play, and look closer at headlines and claims which limit the set of energy sources to meet our many and varied challenges. Optimism is one thing, but ask yourself what the numbers might really be saying.


24/7 Non-Intermittent Stream

In his April editorial Solving the Energy Trilemma, the president of the Australian Academy of Technology and Engineering states that small modular reactors may change the equation on nuclear energy economics and, “if that turned out to be the case, Australia would lag behind the rest of the world”, because Australia prohibits it outright.

He goes on to say,

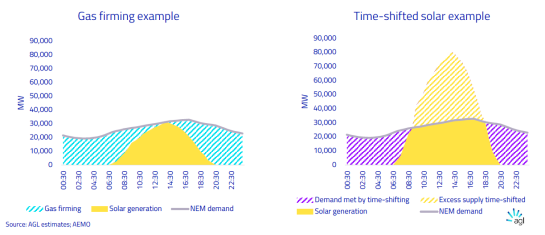
Suppliers of variable renewable electricity generated from the sun and wind need to ensure 24-hour supply through the use of energy storage. While there has been a lot of noise in the media about whether renewables can achieve continuous supply, the answer is very clearly that they can. It will require storage but the massive investments going into batteries and other grid storage solutions… give us confidence that we shall be able to meet this need.

Courtesy of futurENERGY

So, it’s definitely time for a good old-fashioned comparison of climate-friendly energy sources. This has been made possible by anticipated sizes, costs and operating parameters reported in online media and the literature. More fundamentally, the energy sources are solar photovoltaic with seawater pumped hydro, and nuclear energy, both effectively dispatchable and therefore hypothetically directly comparable.

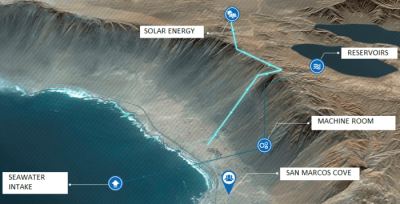
In August 2014 the combined Valhalla Cielos de Tarapacá and Espejo de Tarapacá project in Chile was announced. It will supply the Chilean grid by day with solar and by night from hydro, using seawater stored on a clifftop reservoir, pumped there with excess solar electricity.

PV capacity………………………………………………..600 MW
Annual generation………………………………………1,800 GWh
Average daily generation……………………………..4.93 GWh
Average capacity factor……………………………….34%
Land area…………………………………………………..1,570 hectares
Expected cost…………………………………………….$900 million USD

PHS power capacity……………………………………300 MW
Max. input energy………………………………………2.28 GWh
Max. output energy…………………………………….1.75 GWh
Round-trip efficiency………………………………….76%
Duration at 300 MW output………………………..5.8 hours
Ave. output supplying for approx. 16 hours……….109 MW
Land area…………………………………………………..374 hectares
Expected cost…………………………………………….$400 million USD

Combined average annual capacity factor
after max. daily charging and discharging*……….31%
Combined cost……………………………………………$1.3 billion USD
Combined land area…………………………………….1,945 hectares
Expected commissioning date………………………June 2020

*This capacity factor is estimated from the average daily PV output, taking into account the maximum energy first stored, then released from the reservoir, subject to the reported round-trip efficiency.

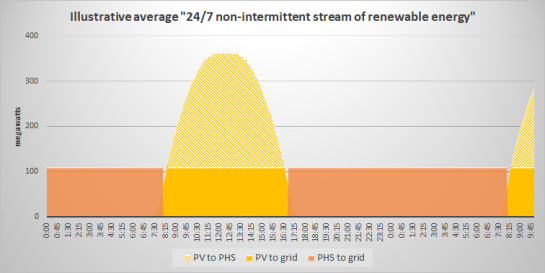
Crucially, this is billed as 24/7 supply in arguably the world’s most favourable location for this combination of technologies. It will be built at about 20.7 degrees south latitude. The Broken Hill solar farm is at 32 degrees south, and using a random full-day’s 5 minute output data as a proxy, a hypothetical “average day operation” of Valhala’s project can be reasonably pictured. This is also important as solar plus pumped hydro is being pursued for Australian electricity supply.

Pumped hydro is the most mature form of grid-scale storage, although it can be argued there is limited experience with seawater pumping. The unique, universally cited Yanbaru facility in Okinawa (substantially smaller than Valhalla’s project) was decomissioned after 17 years. However, storage capacity is not generation capacity. Where the former is added to support the latter, it effectively increases the cost of generation without adding any further capacity. What is fundamentally changed is the dispatchable value of the generation. This has already been stated as being directed toward “24/7 supply”, often thought of a baseload.

In November 2017 Canadian nuclear energy start-up company Terrestrial Energy concluded the first phase of the pre-licensing vendor design review after several succesful rounds of capital raising, with the potential for building a prototype at the Chalk River Labs site. In March 2018 the company signed an MOU with Idaho National Labs regarding building another reactor unit at that site. This is a molten salt reactor design, the IMSR®, which features liquid fuel and intrinsically passive operation based around gravity and convection.

The company’s key commercial claim is:

IMSR power plants are a low cost clean energy alternative to fossil fuel combustion and they can be deployed in the 2020s.

A recent article in Annals of Nuclear Energy, along with other presentations, provided some specifications.

IMSR capacity………………………………………………..291 MW
Annual generation………………………………………….2,343 GWh
Typical daily generation………………………………….6.98 GWh
Average capacity factor……………………………………92%
Land area………………………………………………………6.8 hectares
Expected cost…………………………………………………$1.08 billion USD

Expected commissioning date……………………………after 2026

The major precursor to this reactor design development effort was Oak Ridge’s MSRE in the 1960s. Terrestrial Energy is only one of dozens of companies planning such a design.

Courtesy of Terrestrial Energy

The emergency shutdown capabilities are incorporated directly into the design of the IMSR vessel and building. By operating as a liquid at high temperature, shutdown intrinsically leads to cooling of fuel instead of overheating. By operating at close to atmospheric pressure, no driving force exists to expel any material from the power plant building. The homogenous nature of the fuel salt allows a six-fold higher efficiency utilisation of uranium than conventional reactors.

The estimated cost listed above is the literature overnight cost (ca. $0.83 billion) plus 30% financing on a five year project as described by the World Nuclear Association.

All else being equal, the Valhalla project will take just about 6 years to come online, while the 291 MW IMSR is more than 8 years from commercial readiness. In total, the former will require 286 times the land area of the latter, and as the IMSR is intended for factory production in the manner of commercial aircraft, with 4-year construction cycles, it has the potential for superior deployability.

To illustrate the land footprint aspect, the conventional Barakah nuclear power project in the UAE is sited on a coast moderately similar to the ocean-bounded Atacama desert. (The most dramatic difference is the absence of a 600 metre cliff – such geography isn’t necessarily common.) By 2020 it will feature four operational South Korean APR-1400 reactors.

Plant capacity……………………………………………………5,360 MW
Annual generation……………………………………………..42,260 GWh
Average capacity factor………………………………………90%
Land area………………………………………………………….8 hectares approx.
Final cost………………………………………………………….$6.1 billion USD per reactor

To “match” the output of one Barakah unit, Valhalla would hypothetically need to build 6.6 PV+PHS projects, requiring nearly 13 thousand hectares (over 1,600 times Barakah’s footprint) at a cost of $8.5 billion USD.

FURTHER COMPARISONS

Plant lifespan (years):
Photovoltaic Solar………………………………………2530
Seawater Pumped Hydro………………………………17
Molten Salt Nuclear……………………………………..60

We are yet to see what will happen at the end of “the industry standard life span” for solar, or how long hydro involving seawater should economically operate for. Terrestrial Energy has indicated a plant lifespan which involves regular 7 year replacement of reactor core units (doubling as secure used fuel storage). The original Molten Salt Reactor Experiment operated for more than 4 years at Oak Ridge National Labs until funding arrangements abruptly changed. Consequently, these figures are only included for interest’s sake.

There are several other parameters which would be valuable to compare, namely the discreet material weight-requirements per TWh, the energy returned on invested, the comprehensive life-cycle GHG emissions, and the levelised volumes of other life-cycle by-products. Values for all of these depend substantially on operating assumptions and the rigour of the associated research. Robust values for both renewable energy/storage systems and advanced nuclear are not readily or publicly available, but will become increasingly important if national policies regarding clean and climate-friendly energy are to be comprehensively, scientifically informed.

The Bottom Line

Growth in renewables long-term depends upon growth in storage.

So says this interesting presentation from AGL. Its thesis reflects a prevalent assumption amoung many energy commentators: deployment of storage will “time-shift” or “fill in the gaps” around abundant intermittent renewable generation at a national scale, and consequently render sources such as “baseload gas” and alternative, fully reliable technologies unnecessary.

  • 2050 NEM demand: 200 terawatt hours
  • Rooftop solar: 15 gigawatts
  • Grid-scale renewables: 75 gigawatts
  • Implied battery capacity: 350 gigawatt hours

By apparently examining the required solar and wind capacity addition to meet annual National Electricity Network demand in 2050, an implied battery storage requirment of 350 gigawatt hours was estimated in the presentation. Including new renewable capacity the total the price tag is around $250 billion.

But 350 gigawatt hours probably aren’t enough.

In this seperate analysis focussing just on South Australia, the annual state demand for financial year 2016-2017 was rendered as a duration curve to clearly illustrate the range and duration of levels of demand.

The area beneath this residual demand curve is equal to the period’s demand which was left un-met by solar and wind generation, despite capacity increase.

By assuming considerably more solar and wind capacity, the duration curve is then filled in to simulate demand. All demand can only be met if both the short peak of about 3 gigawatts as well as every hour of remaining residual demand is served from stored power. The result is nearly 1,000 gigawatt hours of necessary storage.

This is just for South Australia, which represented less than 6% of annual demand on the NEM in 2016. Simple extrapolation suggests that AGL’s 350 gigawatt hours are insufficient by orders of magnitude.

But do they really know about “batteries”?

There are several other vital considerations:

  • Batteries – and AGL is specific that this is battery storage – might have economical lifespans of 15 yearsLithium ion will dominate the market and expected cost declines are based on this chemistry, but improvements in performance will be only marginal. Therefore, whatever capacity is installed over the next two or more decades will require complete replacement before the specified 2050 target year. This, of course, goes for solar and wind installations too (25-30 year expected economic lifespans), necessitating that at least the full 90 gigawatts be built.
  • The quoted construction cost for battery storage corresponds to the expected $/kWh cost in 2025 under the Finkel Review modelling of lithium ion battery storage cost declines, implying a multi-year delay prior to large-scale build.
  • For rapid national decarbonisation of energy, or at least electricity, as a climate priority, battery storage-supported renewable energy is presented as the path to the low carbon future. The most recent analysis of lifecycle emissions of renewable/battery supply systems suggests intensities of 110 g for wind and 160 g for solar when supported by lithium ion technology mass produced by established suppliers like South Korea. Is this low enoughChina is expected to dominate battery supply chains and exports in the future.

from Baumann et. al, 2017, Energy Technology, 5(7), 1071-1083

  • It’s way beyond the scope of this article to “lobby” AGL to begin considering nuclear energy, but to put the cost equation in perspective:Hinkley Point C in the UK will be a twin-unit EPR nuclear plant, providing 3.26 gigawatts for an expected cost of £18 billion. It’s habitually used to signify how expensive nuclear energy is to build. Using this design at this price, it would cost $250 billion (Australian) to generate that 200 terawatt hours in 2050 with nuclear energy.The EPR has a single 1.6 gigawatt turbogenerator, and there is likely nowhere this would ever fit on the NEM (currently the largest generators are the 660 megawatt coal-fired units at Bayswater in NSW). At an anticipated $3 billion USD per 570 megawatt plant, NuScale‘s small modular reactor technology is a technically superior option now being mooted for Australia.Such SMRs would conceivably meet demand through 2050 for around $170 billion AUD.They also have a design lifetime of sixty years.

Even with Australia’s vast share of uranium reserves “100% nuclear” is a stretch and no authority is proposing it. The low carbon future will likely be a diverse mix. If you’re going to prognosticate out to mid-century, however, including an energy technology which can last till then is probably a great idea.